
Builders
Residential land pricing data, benchmarked against live competing stock
Pricing to market requires knowing which lots are available to secure, which sizes and price points are transacting, and what’s coming next.
Terralytics combines ten years of sales and settlement history with current stock levels, upcoming releases and construction pipeline data — giving your team full visibility of lot availability across any chosen search area, the sizes and price points selling today, absorption rates, and the product being designed for release. The result: designs, packages and marketing spend consistently aimed at the stock that’s actually moving.
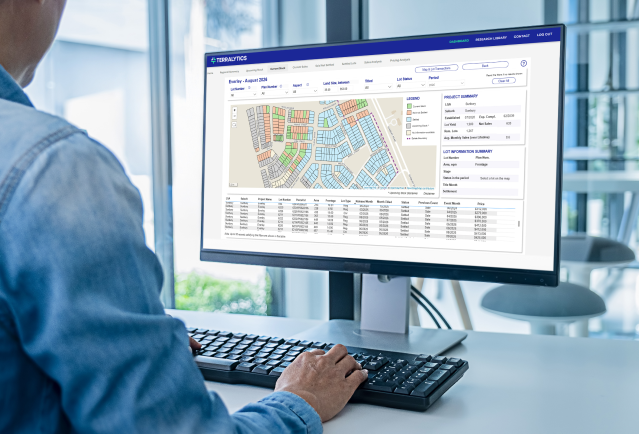










Builder stock data, mapped the way you work
The map is where most of the work happens. Move from corridor to project to lot, see sales activity by area, and spot where a product type is selling out or stacking up. Plan land acquisitions and release timing around what the ground is doing, not a static report from last quarter.
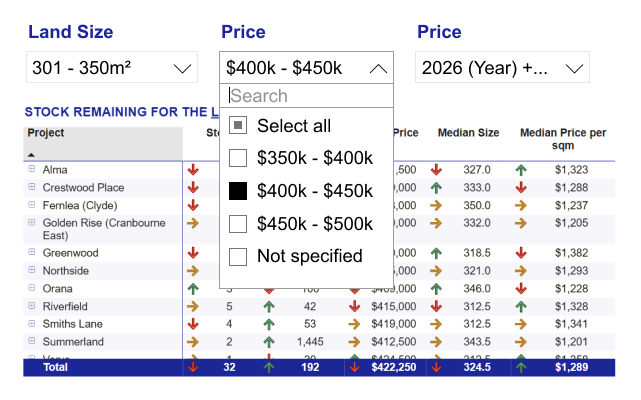
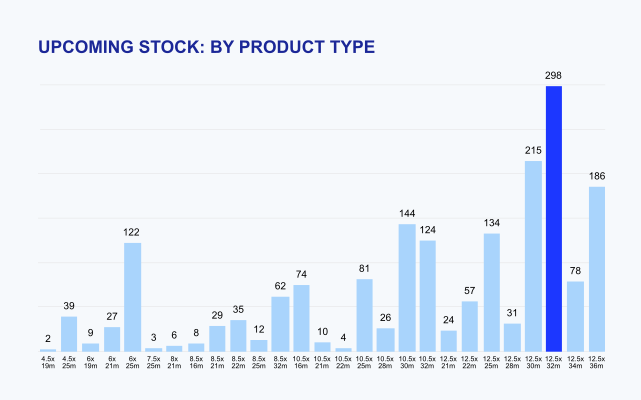
Lot size and frontage data in a single view
Drill into any estate to compare lot sizes, frontages, stages, prices and $/sqm, with sales dates attached. See which product is selling and where a size or price point is thinning out, then price your land against live competing stock. Built for land acquisitions, pricing and sales.
See Terralytics in action
Book a demo to see how Terralytics can enhance your decision making through accurate, timely land market intelligence.
Frequently Asked Questions
Pricing residential land against competing estates starts with lot-level detail – size, frontage, stage and $/sqm – mapped across every project in your corridor. Terralytics lets you benchmark your available lots against what’s currently listed, selling and settling nearby, so pricing reflects live market activity rather than a static report.
By comparing sales rates, price movement and stock levels across competing estates, builders can identify where a lot size or price point is in demand and where it’s thinning out, supporting more confident, defensible land pricing decisions aligned with current buyer activity.
Demand for residential lot sizes and frontages can vary across Melbourne’s growth corridors, depending on location, price point, project and buyer preferences. Terralytics allows you to analyse lot-level sales data to see which lot sizes and frontages are selling, how quickly they are moving and how they compare with competing estates.
By analysing sales activity across Melbourne growth corridors, builders can identify patterns in buyer demand, benchmark their available lots against competing projects and make more informed decisions around lot mix, pricing and project positioning.
Terralytics maps active and upcoming stages across every project in a corridor, so you can see where new lots are due to come to market, at what sizes and frontages, and how quickly current stock is selling.
That release timing view lets you plan land acquisition and pricing ahead of competing stock being listed, rather than reacting once it is already on the market.