Turning Fields into Futures

Explore the pace and pattern of urban growth and development, leveraging 15 years of mapped data from state level to individual lots.

Request a Demo

Plan effectively with Terralytics

Terralytics empowers professionals across development, finance, planning and government to analyse land market performance across time and geography with unmatched precision. It brings decades of structured land data to life, from lot supply and sales activity to pricing trends and settlement patterns, all in one powerful, intuitive platform.

Built for what's next, Terralytics is engineered to drive smarter, future-ready decisions across policy, investment, and project strategy.

Terralytics by the numbers

  • 700kLots mapped
  • 3,700Projects active & complete
  • 40LGAs captured

Land data solutions tailored to your needs

Tailored Reporting
Product Alignment
Product strategy
Planning tools
Market intelligence
mapping_the_feature_1

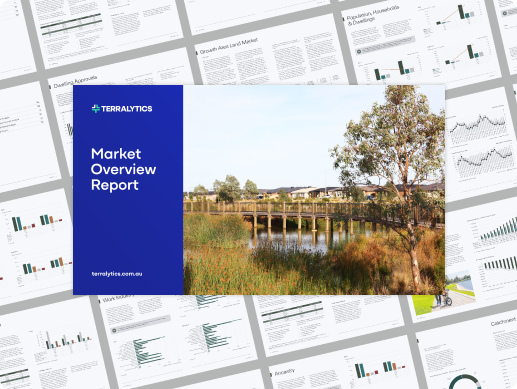
For deeper market understanding

Gain greater clarity on the forces shaping the market with tailored reports across greenfield and infill markets.

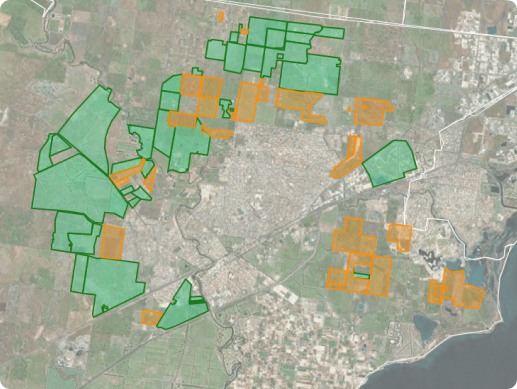
  • Identify geographic demand and growth patterns
  • Analysis of economic, political, and financial market influences
  • Better understand pricing pressures, stock availability, and buyer behaviour.
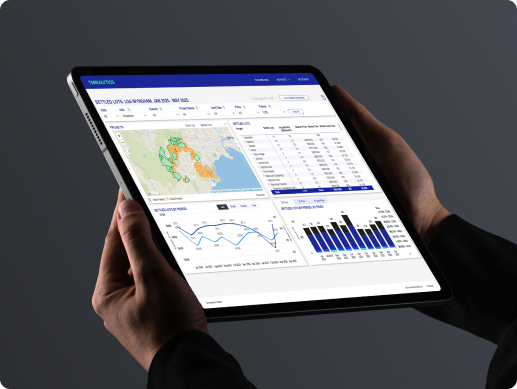
mapping_the_feature_1

Clarity across every stage of the land market

land_data_specialists_1

Datasets on the full lifecycle

Gain visibility over the development process, from release timing and sales data to construction and settlement timeframes, supporting acquisition, planning, and pricing.

land_data_specialists_2

Interactive dashboards, defined by you

Quickly focus on the data that matters. Filter and segment by location, lot type, price, or timing with flexible dashboard tools.

land_data_specialists_3

Deeper, broader coverage

Access comprehensive land supply and sales data across more LGAs, estates. View 15 years of granular detail, with customisable coverage and filtering controls.

land_data_specialists_3

Tailored Reporting

Commission tailored research consulting services. Custom created reports by one of our leading industry partners.

Core features, engineered for you

Easily select custom areas by circling regions, projects or selected lots of interest

img-001

Toggle between high-level trends and detailed lot-level information, with filters that let you track changes across any time frame. Visualise market dynamics with clarity and precision.

  • Filter by lot status: available, sold, under construction, or titled
  • Compare estate performance within and across LGAs
  • Identify pockets of demand and pricing pressure instantly
img-001
img-001

Explore land data your way through interactive maps or detailed report view

img-001

Break down data by LGA, suburb, project, or custom-drawn areas. Filter by lot size, price tier, or expected title timeframes, including settled lots, with the ability to drill down to individual lot details in just a few clicks.

Filter & view data by:

  • Current sales (sold not settled)
  • Lots under construction
  • Settled lots
  • Current Stock

Insights that scale with your business

img-001

Whether you’re overseeing a single project or a national portfolio, Terralytics scales to support strategic planning at any level.

  • Switch seamlessly between macro and micro geographies
  • Align views with internal reporting structures
  • Track project pipelines by stage or delivery timeline
  • Support stakeholder engagement with export-ready data
img-001

See Terralytics in action

Book a demo to see how Terralytics can enhance your decision making through accurate, timely land market intelligence.

Book your Terralytics demo today

Tell us about your role and goals, and we’ll show you how Terralytics can support your work.

enquiries@terralytics.com.au | +61 (3) 98XX 9XXX